Hi Friends,
I wish you a very warm New Year. As we know perhaps if there is any year
that we would have waited eagerly it will be 2021 for sure. Personally, for me it
is a mixed year however my blog last year had 40K views which for me is a huge
achievement.
I would like to thank all of you for going through my posts and posting
your valuable comments.
Coming back to our discussion being a DBA the most important thing is to
have Monitoring in Place so that we can go back to History and see what drove
us to failure.
If you are working in bigger firms obviously there will be Monitoring
tools in place. However, how about companies that cannot afford money.
These days with the growing technology we need to keep ourselves updated
on a regular Basis. Today I am going to discuss 3 free tools which will be very
handy if you can make use of them.
InfluxDB is
an open-source time series database, developed in Go by InfluxData. InfluxDB is
optimized for fast, high-availability storage and retrieval of time series data
for metrics analysis. This can be installed on a single server or as a
clustered instance (Enterprise edition only).
Telegraf is an agent, written in
Go, for collecting, processing, aggregating, and writing metrics. It must
be installed on all devices that need to be monitored, and all metrics
collected by Telegraf are pushed and stored in InfluxDB.
Grafana is
an open source, feature rich metrics dashboard and graph editor for Graphite,
Elasticsearch, OpenTSDB, Prometheus, and InfluxDB. Data stored on InfluxDB will
be visualized using Grafana.
Before explaining them, I would really like to thank Tracyboggiano She completely explained how to make use of
them. But in my blog, I will explain how to make use of them by installing
those tools in Windows Environment and even for Azure Managed instance.
I would like to proceed with installation of Grafana first and then I will just show case an example.
you can make use of the below link and just look into the instructions of Grafana. you can ignore the rest
http://sqltouch.blogspot.com/2017/03/using-perfcollector-with-influxdb-and.html
In the above blog the author made use of perf collector which I am not making use of.
Once you are finished with the installation you can open the link http://localhost:3000
By default, Grafana listens on port 3000 so ensure that port is being opened on the firewall.
Coming back as said I will just share an example on how to make use of only Grafana. Many of you might already aware of Ring Buffers in SQL server. Using that we can capture 4 hours CPU history. Imagine you want a pictorial representation of the usage on all your servers then you can make use of Grafana.
H
How can we do this you can make use of the below links to understand how it works for sample Data.
https://www.sqlshack.com/overview-of-the-grafana-dashboard-with-sql/
https://www.mssqltips.com/sqlservertip/6008/sql-server-time-series-data-visualization-with-grafana/
For Visualizing CPU History against all your servers you can make use of the below query as an example
SELECT
$__timeEpoch([Event Time] ),
[server Name] as "metric",
[SQL Server Process CPU Utilization] as SQL_UT,
[Other Process CPU Utilization] as other_UT
FROM
[CPU_History]
WHERE
$__timeFilter([Event Time])
ORDER BY
[Event Time] ASC
If you have data already being collected and it is time series based and you need graphical representation then there is no better than Grafana.
Coming back to other tools (Influx and Telegraf) you can make use of the above links for the installation.
you need to install telegraf on any one of your test servers and in the configuration file to collect the data you just need to make the below changes in the output plugins and input plugins
urls = ["http://XXX.XX.XXX.XXX:8086"]# required
## The target database for metrics (telegraf will create it if not exists).
database = "telegraf" # required
[[inputs.sqlserver]]
servers = [
"Server=localhost;Port=1433;User Id=telegraf;Password=XXXXX;app name=telegraf;log=1;",
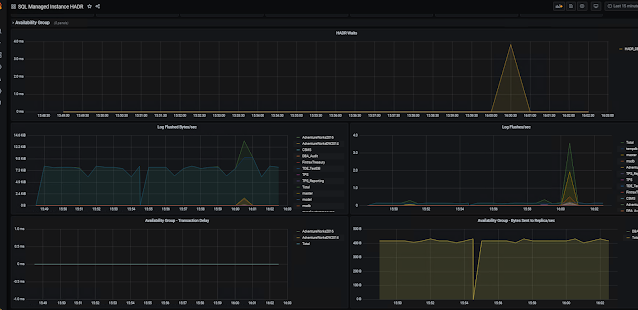
once you are done below are some of the reports what you can see
H
As you can see you really get the feel of the Monitoring tool also if you are running on SQL Server 2016 you can make use of the Query store to work from a query standpoint as well. This is just my idea and you can go through my views and implement them as per your needs.


Comments